


Contacts Heatmap: Your Battle Plan to Sell More, Efficiently

As a sales leader, you’re constantly pressured to sell more with smaller budgets. Sellers feel it too. They spend less than a third of their time on customer facing activities, while “getting ready to sell” tasks like researching prospects and prioritizing leads are cumbersome and inefficient.
In an afternoon, though, you can provide them with a Contacts Heatmap – a one-page, visual “battle map” that instantly shows them where to focus their energy, where the biggest opportunities are hiding, and where their weak spots lie.
It’s not a complicated new piece of technology, or an expensive consulting project that will take months to deliver value. It can start with a simple grid you can build in excel – and it’s a powerful tool for transforming your raw CRM data into a clear, actionable strategy that will align your sales and marketing teams and drive predictable growth.
From a Contact List to an Meaningful Visual
The Account Penetration Heatmap is a simple way to get a visual snapshot of “who you know” in your target accounts, with a focus on the personas that you most need to win.Here’s how to build it:
- Categorize your Contacts by Buyer Persona: You know who your most likely buyers are in any account – and for many products, it’s more than one type of person. Maybe your typical buying committee includes a CFO, an Audit Director, a Compliance Officer, and an attorney. Begin by mapping all of the titles you have on CRM contacts to one of these key personas, and create an “other” category for the contacts you have with irrelvant titles.(Hint: if they’re not important to your buying process, you might want to get them out of your sales and marketing systems!)
- Export Your Data: Explort your contact list of everyone that you’ve got contact information for (email address and/or phone) that is in one of your target personas. Include company name, persona category, and contact name.(Hint: You can skip this step if you’ve got good reporting skills in your CRM tool).
- Create a Pivot Table: Now create a pivot table that lists your target companies as rows, your personas as columns, and fills in the cell values with the names of the contacts you have in that role at that company.It might look something like this:
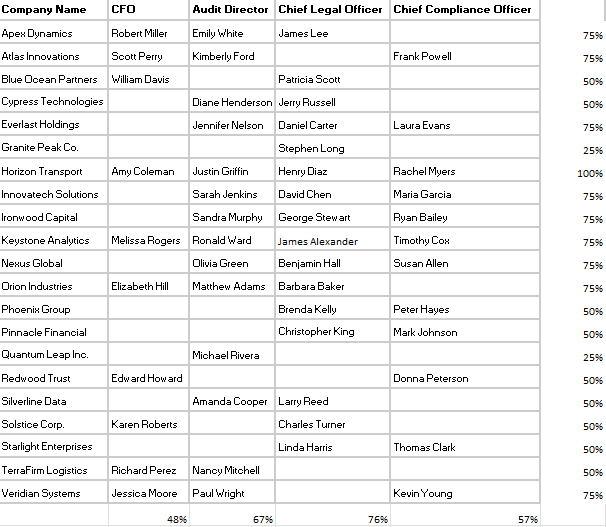
For larger organizations with bigger prospect lists, you might have a more complex set of reports and data visualizations than this excel view, but it should still be a useful metaphor to guide your thinking.
Three Immediate Actions
With this visual, you can now take three immediate actions.
- Prioritize your outbound and ABM Activity. Look at the rows on your heatmap. The ones that are the most filled-in—your “most known” accounts—are your prime targets for an immediate ABM campaign. You already have broad coverage of the buying committee, so you can launch a coordinated, multi-touch campaign with confidence, knowing your message will reach multiple stakeholders. In the grid above, I’ve calculated a percentage of “personal completeness” that sellers can sort by to determine which account to call next.
- Plan your next marketing event or campaign. Now, look at the columns. Is your “Chief Legal Officer” column almost completely full? That’s your audience for your next marketing campaign. You can launch a broad-based webinar or create a whitepaper specifically tailored to the pain points of this persona, knowing you have a ready-made list of high-quality contacts to promote it to. This aligns marketing’s efforts with sales intelligence, ensuring campaigns are targeted at the personas you have the most access to.
- Prioritize account research. Finally, look at where you’ve got empty cells. This whitespace transforms a vague directive like “find new leads” into a specific, targeted mission. At the bottom of my chart, I’ve calculated the percentage of accounts where we have contact information for each persona. Recognizing that we have identified less than half of the CFOs in our target accounts, I can now priorize that as the next place to start building up my database.
Taking it to the Next Level: Adding an Engagement Score
Once you’re taking action from this basic heatmap, you can make it even more powerful by adding a second layer of data: prospect engagement.Instead of just a filled or empty cell, you might color-code each contact based on their engagement with you. Have they opened your emails, downloaded a whitepaper, or attended a demo in the last 90 days? Color coding contacts by volume of engagement creates a true “heatmap” to guide your focus.
- Dark Green: Highly Engaged Prospects. These are the leads who are actively interacting with you—requesting demos, asking specific questions, or responding to emails. These are your highest priority. Your best sellers should be focused here, using personalized, high-touch follow-ups to move the deal forward.
- Light Green: Moderately Engaged Prospects. These contacts have shown some interest, like opening an email or visiting your pricing page, but aren’t fully engaged. Continue to nurture them with relevant case studies, invitations them to webinars, and other relationship-deepining activities.
- No Color: Low or No Engagement. These are the contacts you’ve just identified or who haven’t responded to outreach.
Your color-coded heatmap might look like this: Again, looking for patterns can help you identify your best next strategic steps. Is there a persona where you have consistently low engagement? Perhaps you need to re-think your messaging or tactics to create content that is more relevant to this key type of buyer.Are there accounts where you’ve got consistently high engagement across all personas? These should be your most likely account wins – so make sure you’re deploying the right executive attention, discounting, or other resources to get these deals closed.
From Chaos to Clarity
A Contacts Heatmap is your quick-hit tool to mvoe from chaos into clarity. By moving your disorganized contact lists into a strategic battle map, you’re giving your team an at-a-glance guide to their next best move. It’s a simple, visual tool that eliminates guesswork, pointing you directly to the accounts ripe for an ABM campaign, the personas to target with your next webinar, and the critical gaps that need immediate research.By layering in engagement data, you sharpen your focus even further, ensuring your team’s most valuable resources are always aimed at the most promising opportunities.It’s more than a report; it’s a practical, tactical plan that aligns your teams, prioritizes your efforts, and provides a clear path to predictable revenue growth.


